RESULTS
To display peak hydrostatic overpressure versus distance from
the charge, we select Display on the View menu (or simply press the F9 key):
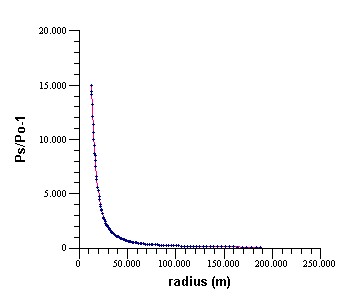
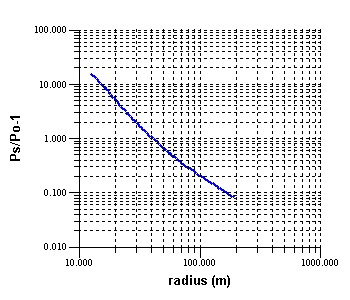
Peak static pressure profile for a 2000 kg ANFO surface
burst, plotted using linear axes (first plot) and logarithmic axes (second plot), with
grid lines added. Graphical format is adjusted using the View menu and/or button
bar and/or by right-clicking on the graph.
Peak static overpressure ratio (Ps/Po-1) is plotted above
on the y-axis. It is the physical property most often used to measure blast wave
'strength'. Above, it is seen to decrease from 15 atmospheres at 12 metres from the
charge, down to just less than 1/10th of an atmosphere at 190 metres (about a city block).
The AirBlast database is now being extended to greater distances and lower
pressures than those shown above (to below 1/100th of an atmosphere), to distances of zero
damage and injury.
The graphical results shown above can also be displayed as
numbers.
Next | Back
| Quit