HEIGHT-OF-BURST (HOB) OPTION
We have been examining a surface burst explosion, in which the explosive
charge is assumed to be hemispherical and placed on flat, hard, smooth ground surface, so
that the blast wave will also be hemispherical. In the Free Air configuration, the blast
wave is assumed to be spherical. (AirBlast has separate databases for the surface burst and free air
configurations, both based on experimental measurements of blast wave properties; it is not
assumed that a surface burst explosion is equivalent to a free air explosion of twice
the size).
AirBlast also provides databases for 'height-of-burst' configurations. In
these configurations a spherical charge is exploded at a finite height above a flat, hard,
smooth ground surface. The spherical free air blast wave is reflected at the ground
surface. The reflection moves away from the point of first contact between the blast wave
and the ground, directly under the charge at ground zero, and then along the ground until
it reaches a distance roughly equal to the charge height above ground, where it undergoes
a transition from the 'regular' reflection (RR) to Mach reflection (MR). Mach reflection
is characterized by a triple point at which the original free-air shock, the reflected
shock and a new shock, the Mach stem, meet. The triple point trajectory starts on the
ground at the RR-MR transition point and rises above the ground.
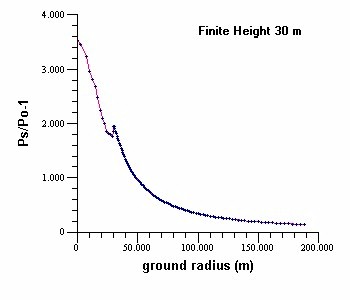
Sample results for a height-of-burst configuration are
shown below:


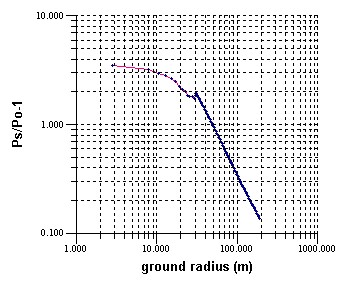
Peak static overpressure vs ground radius for a
2000 kg of ANFO detonated 30m above the ground surface, using linear axes (first plot) and
log-log axes. Note that logarithmic axes are only able to plot values greater than zero
and that in height-of-burst configurations AirBlast calculates data at ground
range zero (ground zero), and that therefore the first data point (0,3.529) plotted in the
first figure, is missing from the second.
In the plots above, RR-MR transition is seen as an increase
in the overpressure ratio around ground radius 30 m. The increase begins in the RR region
before transition, where peak pressures are calculated using the free-air database and
two-shock reflection theory. After transition, in the MR region, results are from
databases of experimental measurements made in actual height-of-burst explosions.
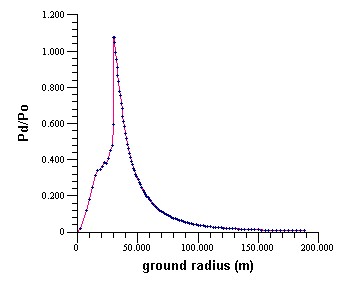
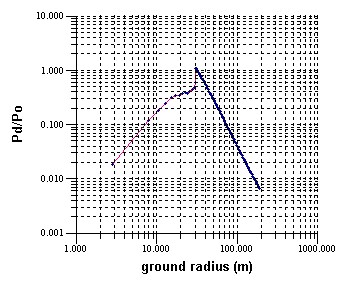
Dynamic Pressures in the example above look like:


Peak dynamic pressure vs ground radius for the
same explosion (height of burst 30 m). Dynamic pressures are generally lower than, and
decrease with distance more rapidly than, static pressures (cf. plots at top of
page), but more interesting perhaps is the fact that dynamic pressure is zero at ground
zero, at which point static pressure is a maximum. This is because the air at the ground
surface at ground zero remains at rest. Note that the point (0,0) cannot be plotted on the
log axes.
Back
THIS IS THE END OF THE AirBlast CONDUCTED
TOUR
 Congratulations on making it this far. We went through considerable
detail towards the end, mainly to stress the fact that AirBlast can provide
a large amount of complex information in an understandable way. We scratched the surface.
Finish


